What is a Heatmap? And Why Is It Helpful For Your Store?
Is it important for you to better understand your website visitors? Aren’t you just wondering how much time they spent on your site or what country they came from?
Then go beyond just using the numbers and get to know the real behavior of your prospective customers.
Understand the performance of pages on your site. These are all important data and are essential for improving the user experience.
So it’s time to talk about heatmaps! Find out where they clicked, what they did, how long they scrolled down your page.
What Is a Heatmap?
In brief, it means a graphic representation of the data. You can discover all the factors which concern you with the users of your website.
Not only can you gather information about what they did, but the heatmap also gives you more than that.
It will also help you find points for improvement on your website. You can see which parts the users ignore.
Get to know the behavior of your page visitors and enhance your user experience. All of this will result in an improvement in your conversion rate.
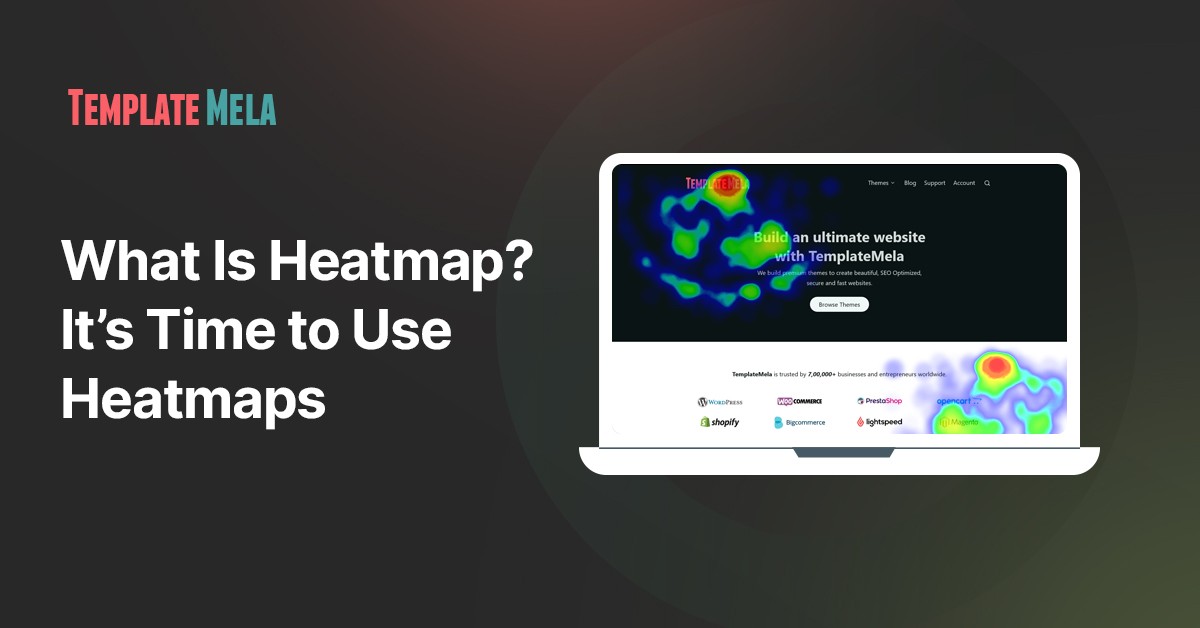
The heatmap graphically displays the required data. To do this, use colors that will be information-rich for you.
Mostly, the darker colors orange and red, are the ones that indicate the busiest area. Lighter and cooler colors, such as light green/blue or yellow, indicate less visited places. Such a tool can be your website’s best friend.
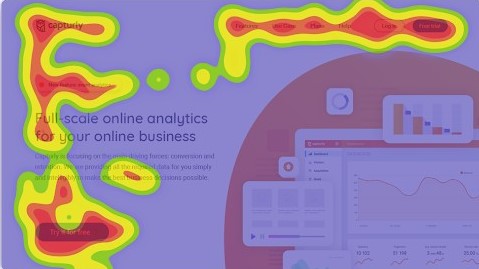
Use it yourself and be part of an excellent data set in which the visual experience is guaranteed! And now let’s show you how it really looks.
Why Would You Need That?
Collect data, analyze, plan, decide! If you would like to raise your website conversion rate, this is the solution for you. Not only can you improve your existing site, but you can also help create a new one.
Take an A/B test comparing 2 possible versions of your website. Use a heatmap to analyze it and see which version caused the most conversions.
You will be able to see which areas and buttons on the 2 pages were attractive and which were neglected. Let’s see some significant examples of this!
- Find the areas and CTAs that performed best on your site!
- Get information about where and what information your visitors have viewed!
- Find the annoying and useless elements on the page to reduce the bounce rate!
- Can visitors easily follow the conversion path? You should know that even a small obstacle can deter them.
The heatmap is therefore useful and not accidentally popular. It provides you with all the information you need to set up a user-friendly website. Last but not least, it can also have a good effect on your traffic!
Heatmaps for a Better UX
To raise the conversion rate, it is also essential to emphasize the user experience. However, it is not enough to be aware of the quantitative data of your site.
These are just simple performance indicators that will help you see the right or wrong direction you are going. The only problem is that you have a lot of data in vain if you don’t know the real reasons.
Suppose you are not happy with the time users spend on the page, the length of the session, or the bounce rate.
The trouble is, these are just data, and you have to find the reasons. In order to improve, it is also essential to obtain qualitative data!
For this, you have this excellent UX research tool at your disposal. Keep track of all the important behaviors that can help you.

For example, let’s look at a visitor’s conversion path. If you no longer get from one stage to another, you would only see from the quantitative data that you have turned back.
Does the heatmap help you find out why the customer chose this way, for example, because of a misplaced button?
It is therefore important to focus on creating an excellent user experience. However, this is a long-term process.
As people change over the years, so do needs. Visitor behavior will change, so it’s important to keep an eye on it. So you should also do qualitative research!
Choose The Perfect One
The question is, what are you wondering what you want to investigate? There are several types of heatmaps. This may all be relevant to you. However, you may need to use only one type to find a solution.

Want to increase CTA conversions? Wondering how long visitors scroll down your website? Interested in how many returning page visitors you have?
These types of heatmaps provide a satisfactory answer to these questions. Let’s see what the main types are and which one will help you!
A click heatmap is a type of heatmap that shows where users on a page have clicked.
This allows you to see how effective the buttons, links, or images, for example, are. Navigation deficiencies are also highlighted.
You can use the scroll heatmap to see how long your page has been scrolling or how much time users have spent on that section.
You can also see how many users have scrolled through your page or left it early.
Finally, the segment heatmap, which helps you filter out what source your site visitors are coming from. Also, where users from each source click.
Make Your Website Better Than Ever
Do you now realize that using a heatmap is essential? Let’s look at some of the potential problems that often occur, but it’s hard to find a solution to them without a heatmap!
Well Placed CTAs
Do site visitors avoid CTAs? Are there a few clicks on them?
Take care of them, as the conversion takes place at these points. Here you decide whether the consumer will buy your product or not.
Also, check with a heatmap to make sure they are well placed. Make them more noticeable and to places that look like a busy section based on the results!

Impressive Images
Make the images effective! A well-chosen image can steer consumers in the direction of CTAs.
To do this, use a heatmap to examine how effective the image you want to place is! If the image depicts a person, you may want to use one in which your eyes or face move in the direction of the CTA.
It also guides the prospective buyer’s eye path.
Website With Good and Readable Text
How long does the visitor scroll, or how readable is the text on the website? Observe the structure of the content with a heatmap, make the text easy to read!
Pay attention to the font size and the appropriate paragraph lengths. Examine how long most visitors scroll down your page. Place CTAs and important information accordingly!
Take Care of The Design!
Is the page design terrible or a lot of unnecessary information? The heatmap shows well the areas that consumers do not pay attention to at all. These are worth taking out, increasing the page’s traceability and clarity.
Reduce The Bounce Rate!
This tool helps you see where a visitor gets stuck on your page. This may also be because it is not clear to him to continue the journey. But it’s also possible that something else on your side will distract him.
Sure Clickable?
Is the consumer clicking that is not clickable? There’s no problem! Replace them with relevant items or simply remove them! Invalid clicks can be converted to actual clicks.

Links In Place
How to place an internal link effectively? If you want more clicks on it, you need to pay more attention to everything.
Place the link as far forward as possible in the text so that the user does not have to scroll much. The visitor is still attentive at this time. Also, pay attention to what the anchor text is like.
The heatmap provides a guide to see where and how to place the link.
When Should You Use This Tool?
When you are curious about the performance of your website, you can collect quantitative and qualitative data.
Whether the results are positive or negative is also well demonstrated by the figures. However, in each case, it is worth examining the results with a heatmap.
Dig deep into what and why happened on your side. Once you understand these, you can easily optimize them.
There is no specific prescription as to when to use a heatmap. It is up to you to open or develop this website as a result of a better user experience.
However, you should be aware that it is not best to use such a tool in the initial stages of a website. Wait all the time until there is actual traffic to your site.
This is necessary because you can analyze a larger sample. This will give you relevant data on consumer behavior.
Final Words On Heatmaps
Sometimes a picture says more than a thousand pieces of data! Sure, don’t just aim to use quantitative data.
You also need quality data to run a quality website. Your product or service can be any good if your site does not provide a good user experience. For a good UX, however, it is essential to use a heatmap.
Make the best decisions that will help your website grow. Optimize user engagement and increase conversions.
However, pay attention to what you are looking for a solution to, so what kind of data you need. It is best to choose a suitable device depending on this. Plan, brainstorm, do an A/B test! And now it’s time to use heatmaps!
![21 eCommerce Trends You Must Be Aware Of [Apr 2022]](https://templatemela.com/wp-content/uploads/Marketing-1-1.jpg)